


Every energy deck has the chart. Projects along the horizontal axis ranked by cost, cumulative volume underneath, a horizontal price line drawn across, and the comforting conclusion that everything to the left of where the line crosses the curve is “in the money.” Investment banks publish one a quarter. Consultancies sell them. Governments plan on them. We have drawn a good many ourselves.
The chart is useful. It is also responsible for more bad forecasts than any other single exhibit in the industry, because it is routinely read as something it is not. A cost curve tells you what it costs to produce a unit of supply that already exists. A supply curve tells you what it takes to bring the next unit to market, at a point in time, with the capital, permits, ships and buyers that unit actually needs. The two are related. They are not the same thing, and the distance between them is where the marginal barrel lives.
Confusion one: a breakeven is a point, not a price
Ask three analysts for the breakeven of a Permian well and you will get three numbers, and all three will be right. One means the half-cycle cost, the price at which a well already drilled pays back its completion. One means full-cycle, including land, infrastructure and the dry holes. One means the corporate breakeven: the price at which the company covers its cost of capital for discovered undeveloped resources. These can differ by $30 a barrel for the same rock.
The same ambiguity sits inside every LNG “breakeven.” A $6 delivered cost for a US cargo is the long-run number, the one a new train needs. The short-run number for a cargo whose liquefaction fee is already sunk is nearer $4. When JKM was $14 in February, both were comfortably in the money. When it fell toward $5 in the 2020 glut, the long-run number said cancel and the short-run number said lift, and the market behaved according to the short-run number, as it always does.
So the first question to ask of any cost curve is: whose breakeven, over what horizon, and what happens to the units already built when the price falls below it? Usually the answer is that they keep producing, which means the curve you are looking at is not the supply curve at today’s price. It is the supply curve for a world that has not yet invested.
Confusion two: the curve has no clock
A cost curve is a snapshot. It ranks everything that could exist as if it already did, and as if it could be turned on tomorrow. A supply curve has a time axis, and the time axis changes the shape completely.
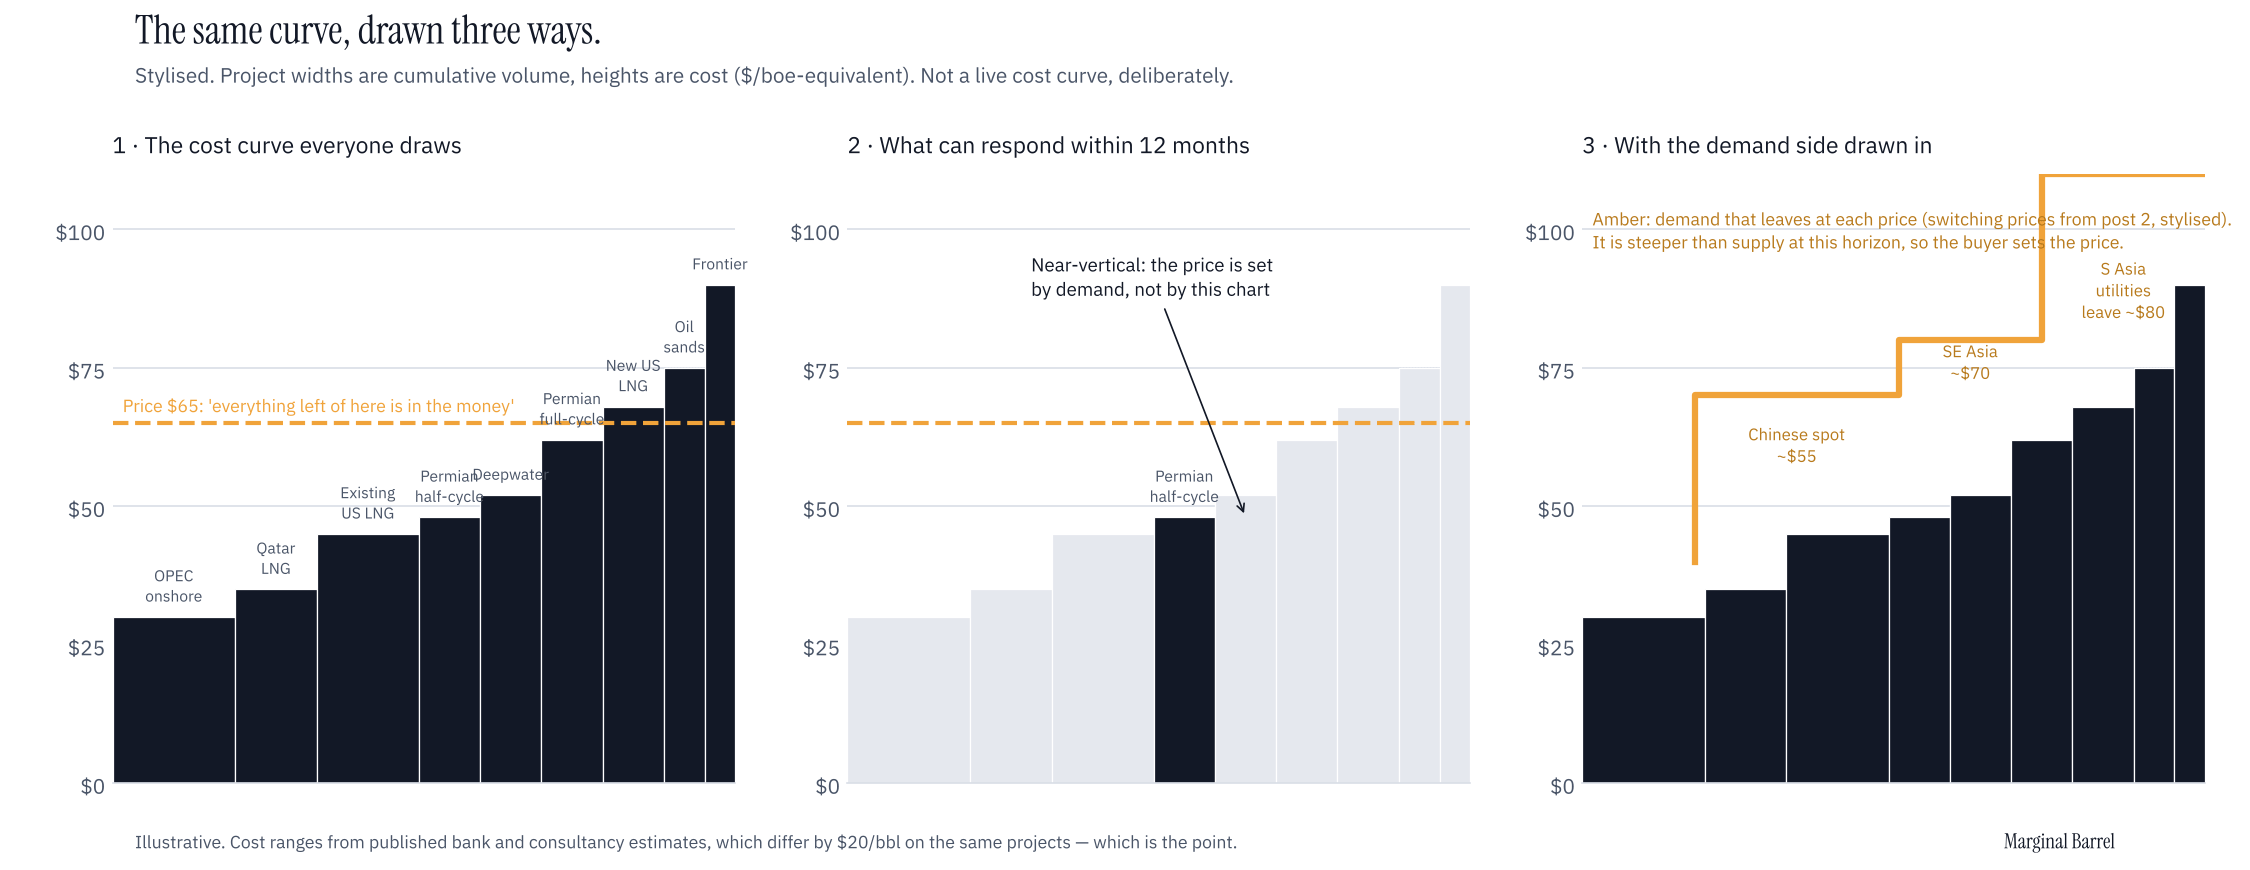
At the one-week horizon the supply curve is almost vertical. Nearly nothing can respond to price. OPEC spare capacity, a few shut-in wells, some LNG cargoes that can be diverted but not created. This is the world the market lived in from March, when Qatar stopped and there was no next cargo at any cost. The cost curve said US and Australian LNG was cheap and plentiful. The supply curve said both were at full utilisation and the next molecule was three years and $10 billion away. The price went to the demand side because that was the only side with a slope.
At the five-year horizon the curve is flatter, but the costs on it are not the ones in the chart. Rystad put the average breakeven for unsanctioned oil projects at about $50 in its last benchmark and then spent 2025 reporting cost inflation across the board. A cost curve drawn in 2023 described a world that could no longer be built at those prices. The projects that can be built at today’s prices, at today’s rig rates and steel prices and with today’s financing, are a different and shorter list.
The difference matters because the price-setting unit is the one at the margin of the relevant horizon. In a tight market that is the unit that can respond fastest, almost regardless of cost. In a loose market it is the unit that can be cancelled cheapest. Neither is the unit at the top of the cost curve.
Confusion three: the chart assumes a buyer
The third problem is that a cost curve is drawn entirely from the supply side. Demand is a flat line across it. In practice the demand side has its own curve, and in the markets we write about it is the steeper one.
When the LNG price doubled this spring the response did not come from new supply. It came from Pakistani and Bangladeshi utilities going back to fuel oil, Indian fertiliser plants shutting, and Chinese city-gas companies disappearing from the spot market. That is a supply curve too, in the economist’s sense: it is the supply of forgone demand, and it had a price at which each tranche cleared. Nobody draws it, because the data is harder and the clients are producers. But it set JKM for six months, and it is still setting it, and any “the price will fall to the cost of the marginal US cargo” view that does not say when and why those buyers come back is not a forecast, it is a cost curve with a wish drawn on it.
How we read a cost curve
We still draw them. We just ask five questions before believing one.
1. Which cost? Half-cycle, full-cycle or corporate. If the chart does not say, assume it is whichever one made the author’s point.
2. Which horizon? What on this curve can actually respond within the period the question is about? Grey out everything that cannot. What is left is the supply curve for that horizon, and it is usually a small fraction of the picture.
3. What is the utilisation? A cheap unit at 100% utilisation is not marginal supply; it is base load. The marginal unit is the cheapest one with room to move, which can be a long way up the curve.
4. Where is the demand curve? Draw it, even roughly: which buyers leave at which price, and which come back. If the demand curve is steeper than the supply curve at the relevant horizon, the marginal buyer sets the price and the cost curve is background.
5. What is the price of the next unit, not the last? The cost of the final increment that must be built to balance the market in year N, with year N’s costs and lead times. That is the number a forward curve should converge to, and it is almost never the number on the published chart.
What this says about now
In oil, the cost curve has been losing since February and will keep losing until the Gulf comes back. The IEA’s October report has 2026 demand down 2.6 mb/d, observed stocks down about 510 million barrels since the end of February, and Gulf output still some 8 mb/d below pre-war levels in the summer. The UAE left OPEC+ in May and took roughly a quarter of the group’s spare capacity with it. The marginal unit is a shut-in Gulf barrel, and downstream it is a diesel barrel: the Singapore gasoil crack printed a record $83 in September against an $18 average last year. None of that is on a cost curve.
But oil has a date on it that LNG does not. Shut-in barrels come back in weeks, and the IEA already has 2027 supply up 7–8 mb/d and the market in surplus. The moment the strait reopens, oil returns to being a market where the marginal unit is a barrel that can be cancelled, the horizon is long, and the full-cycle cost of the next Permian or Guyanese increment is a decent anchor for the price. We would read the oil cost curve as a supply curve for 2027, not for 2026, with the single caveat that spare capacity is political, not geological, and a cost curve has nothing to say about politics.
In LNG it is the opposite, and will be until Hormuz reopens. The supply curve is vertical at every horizon short of 2028. The marginal unit is a buyer. Any analysis that starts from “US cargoes cost $7, therefore…” has the right number and the wrong curve. The $7 matters only as the floor the market returns to when the demand side stops setting the price, which is a question about ships in a strait and not about cost.
And in power, which we will come to, the confusion is worst of all, because the cost curve everyone uses, levelised cost of energy, does not even pretend to have a time axis. We will say more about that when we get to the marginal megawatt-hour.
What would change our mind
If the LNG price falls to the US delivered cost before Hormuz reopens and Qatar returns, then demand destruction was larger and more permanent than we think, the demand curve has moved out beyond the supply curve, and the cost curve was the right chart after all. If oil spends 2027 well above the full-cycle cost of the next increment with spare capacity still at 3.5%, then something other than cost is setting the price there too, and we will need to find it. We will say so when either happens.
A note on sources: the oil figures are from published bank and consultancy estimates and are cited below. We have not drawn a live cost curve here because the published ones differ by $20 a barrel on the same projects, which is rather the point.
Sources
IEA, Oil Market Report, August 2026: Gulf output 8.3 mb/d below pre-war in July; cumulative stock draws since end-February.
IEA, Oil Market Report, October 2026: 2026 demand -2.6 mb/d; observed stocks -509 mb since end-February; 2027 supply +7.7 mb/d.
Rystad Energy via Air Freight News, 30 Apr 2026: UAE exit from OPEC+ effective 1 May; ~1.5 mb/d of the group’s ~6 mb/d spare capacity.
S&P Global, 29 Sep 2026: Singapore gasoil crack record $83.02/b on 16 Sep vs $18.16/b 2025 average.